Beiträge
Themengruppen
Recherche
Service
- Was ist Wissensmangement?
- Open Journal of Knowledge Management
- Artikel-Guidelines
- Newsletter
- Kalender
- Wissensmanagement-Anbieter
- Partner
- Mediadaten
Community
Sponsoren


Data Trees as a Means of Presenting Complex Data Analysis
08. August 2013 von Sally KnipeData that already exists can be a useful source for researchers, provided that the mining or collecting of the data is undertaken with a clear understanding of the possibilities and limitations of the information gathered and analysed. Analysing existing data adds to the knowledge that has already been acquired, and in some cases may ‘pull together’ knowledge. Government departments’ national and international organisations collect large amounts of data that could be used for research purposes. Mining data provides trends and patterns that are very complex, and, finding a method to present this data, for publication to a broad readership, can be challenging. This article reports on the use of data trees as a representation for presenting data extracted from large data sets and presents a concise model for publication.
The article was submitted for the Open Journal of Knowledge Management VII/2013.
Introduction
An investigation that seeks to describe a situation can draw on existing data held in large government data bases as a useful source of information. Accessing existing data has become a much easier process with technological advancement in the collection, storage and retrieval of large quantities of data. Government departments’ national and international organisations are key contributors to the development of large data bases that contain numerical information representing various aspects of a society. International, national and state data provides vast amounts of information that can be organised, analysed, and used to present evidence on which policies are developed and funded, resources are allocated and research is reported.
The technological capacity now exists to gather very large amounts of data and, as a consequence, new techniques of data analysis have been generated. Data is mined and trends and patterns in data identified as a process of discovery, which is described as ‘Knowledge Discovery in Databases’ (Miller & Han 2000). Unlike hypothesis testing, whereby the researcher gathers data relevant to the hypothesis being tested, data mining and knowledge discovery is more akin to hypothesis generating, in that the researcher does not always know what is contained within the data base.
The collection of national data by government authorities in Australia, has a long history; for example, population counts were first undertaken in 1788, and were referred to as a ‘muster’. These musters were important to the early Australian colonies in order to match the required amount of resources, such as food, with the growing number of people inhabiting the settlements. The concept of a population count continued in Australia up until the first formalised national census undertaken in 1911, under the Census and Statistics Act of 1905 (Australian Bureau of Statistics, 2001). Since then, the collection of national data has been evolving to reflect and address the changing social and economic circumstances of Australian society.
Data held in large databases, such as government databases, are an effective and useful source of existing data for a range of disciplines. In the education sector, for example, a considerable amount of data are collected by government and non-government organisations on a range of topics, such as the academic performance of students in primary and secondary schools, attendance and retention rates across school sectors, participation and completion rates in the tertiary sector (including part-time and full-time), and the number of teachers employed in government and non-government schools. The amount of time and cost saved in using existing data could be a benefit to researchers if data available were relevant to an investigation. Assuming that the design of procedures that were employed in gathering data was robust, the sample available to researchers would be much larger than samples usually available to researchers who gather data for a research project. However, a limitation in using existing data concerns the fact that the data have been collected for different purposes.
One area which has undergone significant change in policy and resource allocation, and which has relied extensively on national trend data, is a period in education that occurs towards the end of the compulsory years of schooling. This is a period when young people begin to enter the various education, training and employment pathways. Throughout the latter part of the twentieth century and early twenty-first century, transition to work had evolved into a complex situation, comprising various ‘school to work’ partnerships, training schemes and work options. A considerable number of government reports, such as the Australian Parliament House of Representatives Standing Committee on Employment, Education and Training (1991), Tohmatsu & Burke (1995), Ainley & Fleming (1997), Standing Committee on Employment, Education and Training (1997), Everingham (1999), Department Education, Employment and Training (2000), as well as a number of research studies, such as Robinson (1996), Marks & Fleming (1998), Teese (2001), Polesel, Teese & Mason (2007), Volkoff & Jones (2007), Muir, Maguire, Slack-Smith & Murray (2008), and Knipe (2009), have documented the changing nature of education and employment for young people. Many of these reports have utilised existing data to present or argue a particular position.
The transition from school to employment for young people is a topic of particular interest to education officials, government policy advisors and employment agencies, given the on-going changes in the role and nature of secondary school education, tertiary education and youth employment. The compulsory years of schooling, and associated pathways for those in the senior years of school, will be affected with moves by most state and territory governments to raise the school leaving age to 17 years.
A substantial amount of data now exists across a range of disciplines (Kriegel, Borgwardt, Kroger, Oryakhin, Schubert & Zimek, 2007), and researchers, professionals, and those employed in Non-Government Organisations can access existing data for research purposes. However, communicating the results of data analysis presents the challenge of working out ways of presenting complex numerical information in a format that allows this information to be displayed in a readable and useful way. For those with limited statistical analysis skill, or who lack confidence in reading large amounts of numerical data presented in complex graphs or extensive spreadsheet formats, such as SUPERTables or WINZip, presentation of data is especially important.
Data trees are a valuable tool for describing, defining, cataloguing and generalising data which enhances the strategies and practices of knowledge management within an organisation. Arranging data in this way provides a powerful mechanism for groups in society to classify information from single or multiple disciplines into layers of facts and figures. Providing information to organisations in this way allows the examination of data from different perspectives to solve problems, identify issues and make predictions.
The aim of this article is to report on a method of presenting complex data using a particular graphing technique. The data in this article is based on participation rates for young people, that is, those 15 to 19 years of age, in education, training and/or employment, in Australia. To explain this technique, data from several national data sets for one calendar year have been extracted, converted and represented.
Formatting Data into Data Trees
Various reports have presented different perspectives of youth participation in education and the labour force, drawing data from different sources in order to illustrate issues. However, data from different sources cannot be compared unless the data sets have been compiled according to common parameters, eg. age, employment status, gender. Few studies have used multiple data bases in research that seeks to capture an overall pattern or trend of education and employment pathways. Previously, data was not as readily available as it is now, and differences in the way data were compiled in particular data sets presented difficulties that could have deterred researchers. To undertake data analysis using different data bases it is important that data bases are freely available, have a state, national and/or international perspective, and have incorporated components, each of education, training and employment.
The task of downloading, transforming and reformatting data from different databases into a useful format, particularly when a small component of data is required, means giving consideration to the way in which these data will be presented. One of the challenges in using data from large multiple data sets is finding a way to represent of data analysis in a format which makes the information readable, meaningful and usable to the consumer.
An initial step required in the data mining process is to identify the variables to be represented and to extract these variables in a format which is consistent for all variable groupings (Nilakant & Mitrovic 2004). This initial step is required because the collection and reporting of data, especially across different datasets, is likely to be reported using various numerical computations. For example, some data sets report data by age (15 years, 16 years), other data sets report data by age groupings (15-19 years), and other data sets report data by participation such as school year (Year 10 or Year 11). In order to present data as a common basic unit some data may need to be re-calculated (Knipe 2009).
Data gathering involved accessing the raw data sets compiled by national government organisations concerning education, training and employment. Two different databases from the Australian Bureau of Statistics (ABS) were accessed to draw data regarding education participation rates and labour force participation rates. The characteristics extracted and described are designated as follows: education (TAFE/University or school), employment (part-time or full-time), not in the labour force and unemployment (part-time or full-time). Depending on the information required by a researcher or an organisation, a range of possible variables could be used for analysis regarding education, employment, and participation rates for young people and some or all of these variables can be compiled into a data tree.
Presenting Existing Data in Data Trees
The process of presenting data in the form of data trees can be undertaken for an area or combination of areas by drawing data from databases compiled by several organisations, as long as the variables being researched are comparable. Data presented in the data trees illustrates an overall situation, in this case the participation rates in education, training and employment of young people for one calendar year. The presentation of data in data trees provides a picture of participation rates, which is easier to understand and express once the data are in a readable format. It means that articulating differences in terms of national trends, participation rates and differences between groups, in either percentages or raw numerical values, is more easily articulated and understood. Given the difficulties some people have in reading data presented in graphs, particularly if the graph is complex, data presented in data trees alleviates this problem (Lee 1990).
Graphs and diagrams are a way of representing structures and models that are relevant to everyday life. Graphs consist of a set of vertices and edges, and the type of graph used to present ‘real-life’ situations, depends on the nature of the modelling being untaken. Graphs can take various forms depending on how the vertices and edges are positioned. There are a range of different types of graphs. For example, there are graphs referred to as ‘trees’ because they contain no cycles and are a useful way of visually categorising or sorting information to represent data ‘graphically’. Data trees are a connected graph with any two vertices joined by a simple path.
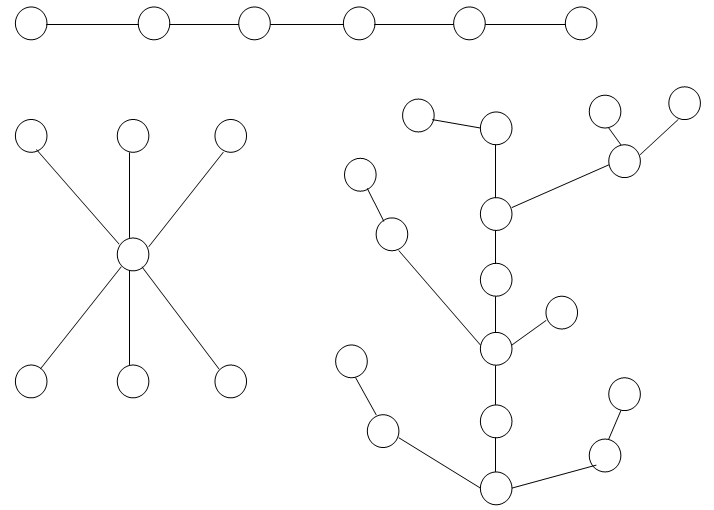
Data trees are an effective and concise way of visually presenting data, allowing the reader to follow the pattern and direction of numerical and written information. A data tree without any cycles (with or without connections) is referred to as a forest and “each component of a forest is a tree” (Chartrand 1985 p. 80). These types of graphs are called trees because when drawn their shape resembles a tree. The general forms and shapes of data trees are illustrated in Figure 1.

Figure 1: General Forms of Data Trees
There are various types or forms of trees. A rooted tree has a designated vertex referred to as the ‘root’, and in this rooted tree edges flow vertically or horizontally away from the root as illustrated in Figure 2 and Figure 3 (Gross and Yellen 2006, p.124).

Figure 2: Rooted Tree with Vertical Edges

Figure 3: Rooted Tree with Horizontal Edges
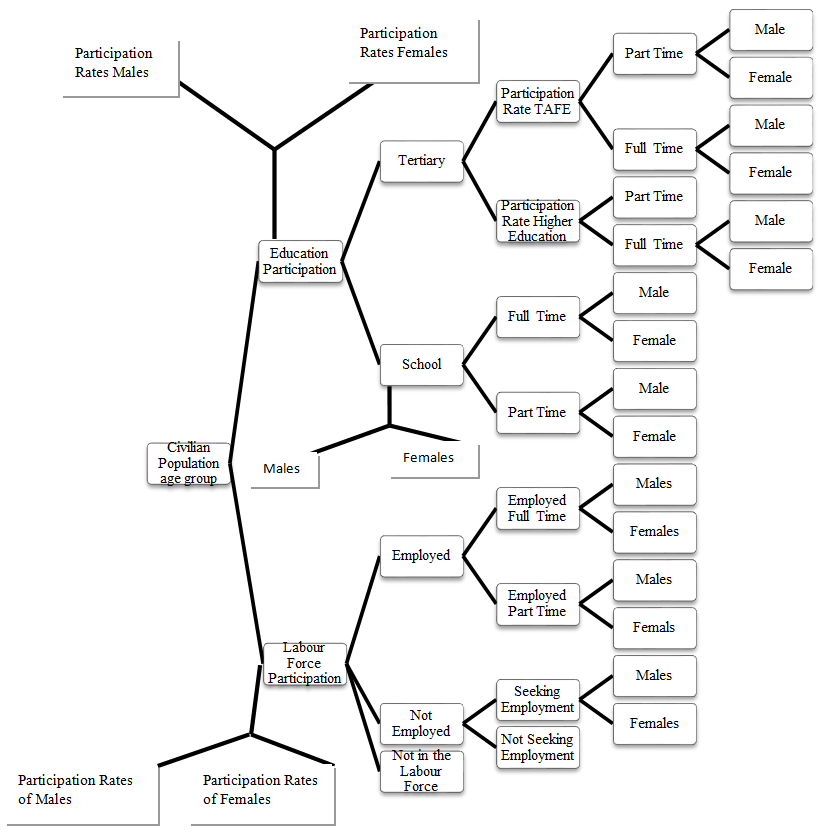
The 15 to 19 year old age grouping was selected in order to demonstrate an example of mining data across data sets. The younger end of the age group would include a majority of young people engaged in school education and part-time work. The latter end of the age group would constitute a majority of young people no longer at school but involved in tertiary education, training, part-time or full-time work. The use of different government data sets enables the development of an overall picture of young people in education and the labour force. This type of model is a conceptual representation of a data structure referred to as a ‘Model for Entity Relationships of Interaction’ (Bader & Hogue 2002, Chen 1976). As the data tree in Figure 4 illustrates, the format allows the reader to follow the flow of information; for example, from the total population of 15 to 19 year olds to overall education participation rates; to the participation rates for males and females; to the total participation rates in education to the total participation in the tertiary sector, then to the total participation in the school sector.
Figure 4: A Model for Entity Relationships of Interaction Data
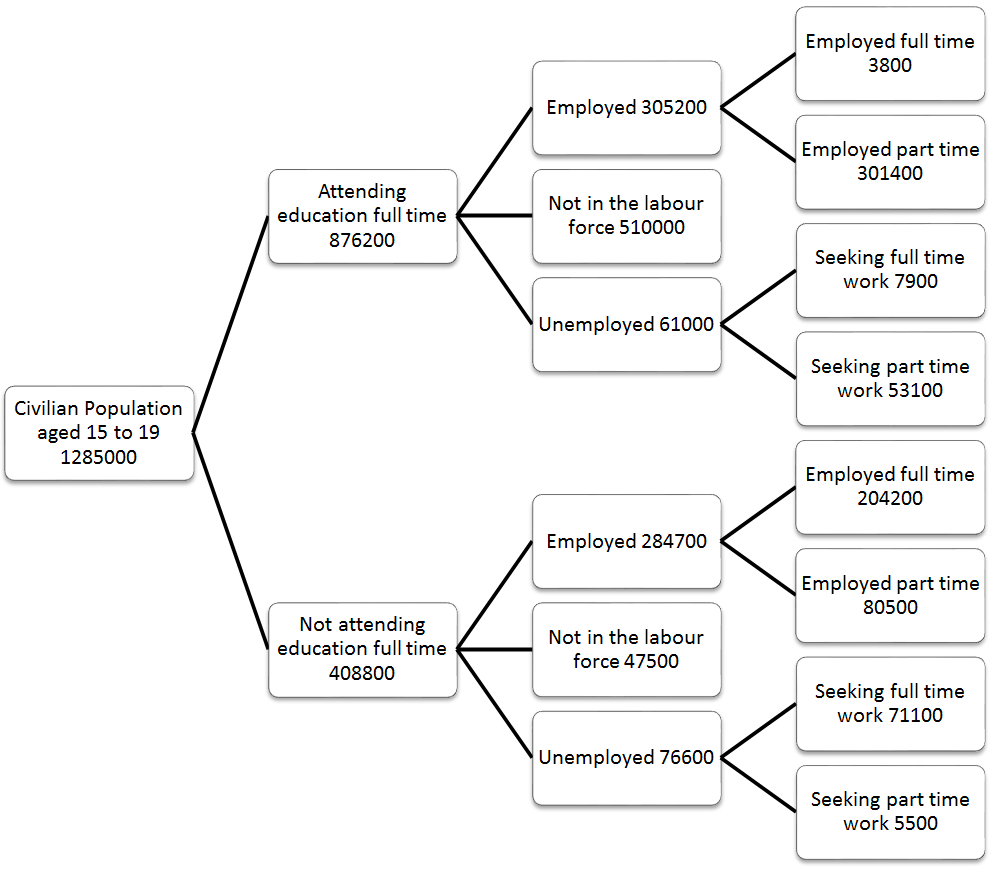
The benefits of uniting data from several data sets into a data tree to create an overall picture means that components of this data tree can be extracted to form other, less complex, data trees. Figure 5 illustrates how the design of a data tree can be constructed using the raw data for a range of variables drawn from Figure 4, in this case related, to education and employment. Data in Figure 5 represents the overall population of 15 to 19 year olds, and the overall participation rates in education and employment, including full-time and part-time participation.
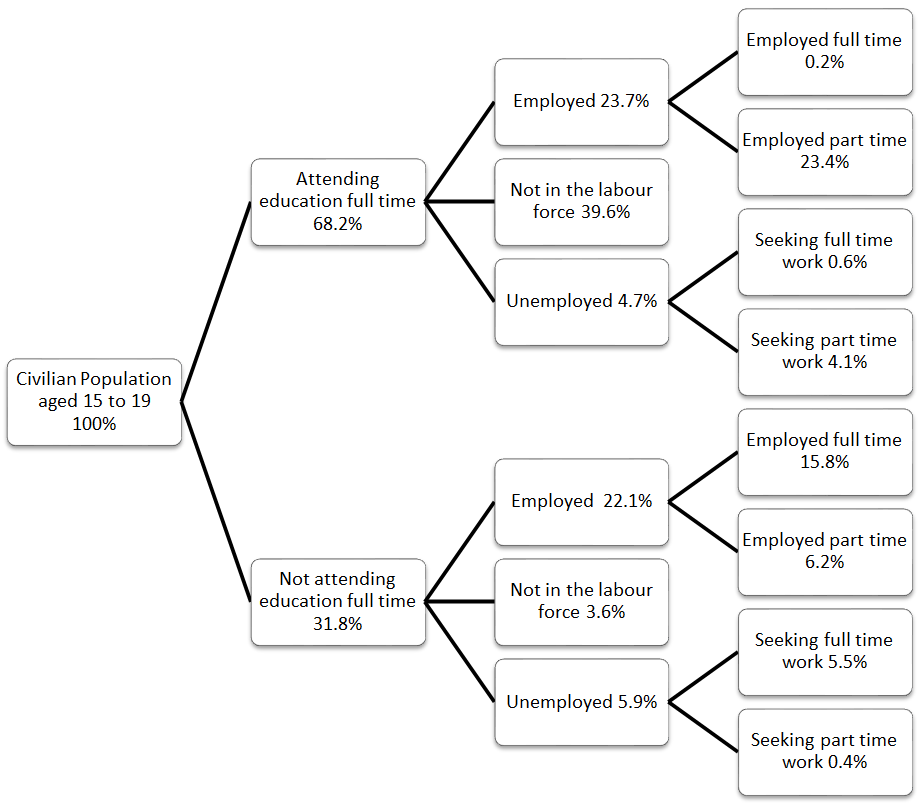
Once a data tree containing the raw figures is finalised, another data tree can be constructed, presenting the numerical data as percentages. Percentages are a succinct way of presenting the numerical data in context. The data tree in Figure 6 follows the same design format as the data tree that contains the numerical data in Figure 5. Figure 6 is an example of a data tree presenting education and labour force statistics as percentages.
When numerical information is added, as in Figure 5 and Figure 6, both the numerical and written information provide the reader with an easy-to-follow format. This graphic technique provides a concise design of condensing and presenting variables. The layout of data trees as represented in Figure 4, Figure 5 and Figure 6 is presented in landscape format, to allow for maximum effectiveness of the data presentation in rooted trees on an A4 page. The format and design of rooted data trees may vary depending on the nature, range and complexity of the data being presented.
Figure 5: Entity Relationships of Interaction Data using Education and Labour Force Data
Figure 6: Entity Relationship of Interaction Data Presented as Percentages
Summary
One of the goals of data mining is to describe patterns or trends that can be interpreted by a range of readers to reveal new information. Data mining involves three main processes: data mining, data transformation and then data analysis. Presenting intricate models containing complex numerical equations is often not relevant or required for most audiences and is an important step in the data transformation process. The presentation of complex data can make the appearance and publication of such data difficult to represent in a coherent way. While it often takes an additional step to withdraw data from existing sources to construct data trees, the holistic inter-relationship of data trees provides a useful format for readers and presents publishers with a complete and concise model.
The collection and use of numerical information is a recognised method of providing evidence for monitoring social and economic indicators and for policy development. National and international data bases provide valuable information to use for research that examines patterns and trends within a society. However, the more complex the data analysis the greater the difficulty faced by a researcher in presenting data in a comprehensive yet understandable format. A useful option would be to organise the data into a series of data tress which provides a clear picture of the complex patterns identified and revealed through data analysis, in doing so, adding to knowledge management through improved sharing of information and greater understanding of the issues under examination.
References
Australian Bureau of Statistics (2001) Colonial census and musters. Retrieved 9 August 2013: http://www.abs.gov.au/ausstats/abs@.nsf/Lookup/2071.0Feature+Article4July+2011
Ainley, J. & Fleming, M. (Australian Council for Educational Research) (1997) School-Industry Programs National Survey 1996. Commissioned by the Australian Student Traineeship Foundation. Sydney: Australian Student Traineeship Foundation.
Australian Parliament House of Representatives Standing Committee on Employment, Education and Training (1991) Skills for the 21st century: a report on skills training, apprenticeships and traineeships. Canberra: Australia Government Publishing Service.
Bader, G., & Hogue, W.V. (2002) Analyzing yeast protein – protein interaction data obtained from different sources. Nature publishing Group, 20, 991 – 997.
Chartrand, C. (1985) Introductory Graph Theory. Dove Publications Inc. New York.
Chen, P. (1976) The Entity-Relationship Model – Toward a Unified View of Data. Transactions in database systems. Retrieved July 26, 2010, from http://dl.acm.org/citation.cfm?id=320440 (paidcontent)
Everingham, P. (1999) Education Participation Rates, Australia – 1997. Department of Education, Training and Youth Affairs Research and Evaluation Branch. Retrieved 9 August 2013 http://www.voced.edu.au/content/ngv32245
Gross, J. & Yellen, J. (2006) Graph Theory & its Applications. (2nd edn). Boca Raton Fla, Taylor & Francis Group.
Lee, B. (1990) The Relationship of Visual Information Processing to Interpretation of Graphs. Unpublished Masters of Education thesis, University of Canberra.
Knipe, S. (2009) Young People in Education and Employment: The Data Trail. LAP LAMBERT Academic Publishing AG & Co. Germany.
Kriegel, H., Borgwardt, K., Kröger, P., Pryakhin, A., Schubert, M., Zimek, A. (2007) Future Trends in Data Mining. Data Mining and Knowledge Discovery. 15: 87-97
Marks, G. & Fleming, N. (1998) Factors Influencing Youth Unemployment in Australia: 1980-1994: findings from the Longitudinal Surveys of Australian Youth. Research Report Number 7. Australian Council for Educational Research. Retrieved 9 August 2013 2001http://research.acer.edu.au/lsay_research/61
Miller, H & Han, J. (2000) Geographic Data Mining and Knowledge Discovery: An Overview. [Electronic Version] http://123seminarsonly.com/Seminar-Reports/034/Geographic-Data-Mining-Knowledge-Discovery.pdf
Muir, K, Maguire, A, Slack-Smith, D & Murray, M. (2008) Youth Unemployment in Australia; A Contextual, governmental & organisational perspective. The Smith Family for the AMP Foundation.
Nilakant, K & Mitrovic, A. (2004) Applications of Data Mining in Constraint-Based Intelligent Tutoring Systems. Retrieved 19 May 2010
http://citeseerx.ist.psu.edu/viewdoc/download?doi=10.1.1.74.9044&rep=rep1&type=pdf.
Report by the House of Representatives Standing Committee on Employment, Education and Training. (1997) Youth employment: A working solution. Canberra: Commonwealth of Australia.
Robinson, L. (1996) School Students and Part-Time Work: findings from the 1995 Year 9 LSAY cohort. Research Report Number No. 2. Australian Council for Educational Research. Retrieved August 2013 http://research.acer.edu.au/lsay_research/6
Teese, R. (2001) VET and young people: it’s a relationship of ironies. Australian Training Magazine. Australian National Training Authority Brisbane, Queensland.
Polesel, J., Teese, R., & Mason, K. (2007). VET in Schools Pathways: The 2005 Year 12 Cohort Report. Melbourne: Victorian Department of Education.
Tohmatsu, D. & Burke, G. (1995) Demand for and Dimensions of Education and Training. Prepared for the National Board of Employment, Education and Training. Canberra: Australian Government Publishing Service.
Victorian Department Education, Employment and Training Communications Division (2000) Ministerial Review of Post-Compulsory Education and Training Pathways in Victoria. Communications Division, Department of Education, Employment and Training.
Volkoff, V., & Jones, T. (2007). Analysis of factors contributing to apprenticeship and traineeship completion. Melbourne: Office of training and Tertiary Education.
Wilson, B. (1989) Early Labour Market Experience of Young people. An Overview, and Proposals for Further Research. Working Paper No. 2. Youth Research Centre, Institute of Education, University of Melbourne.
Kommentare
Das Kommentarsystem ist zurzeit deaktiviert.


